The first national pay transparency laws are now in force, and the first reporting deadline for 150+ employee companies is under a year away: 7 June 2027. The conversations we have with HR teams have shifted accordingly. The question is no longer “what does the directive say?” but “can we stand behind our numbers when someone asks?”
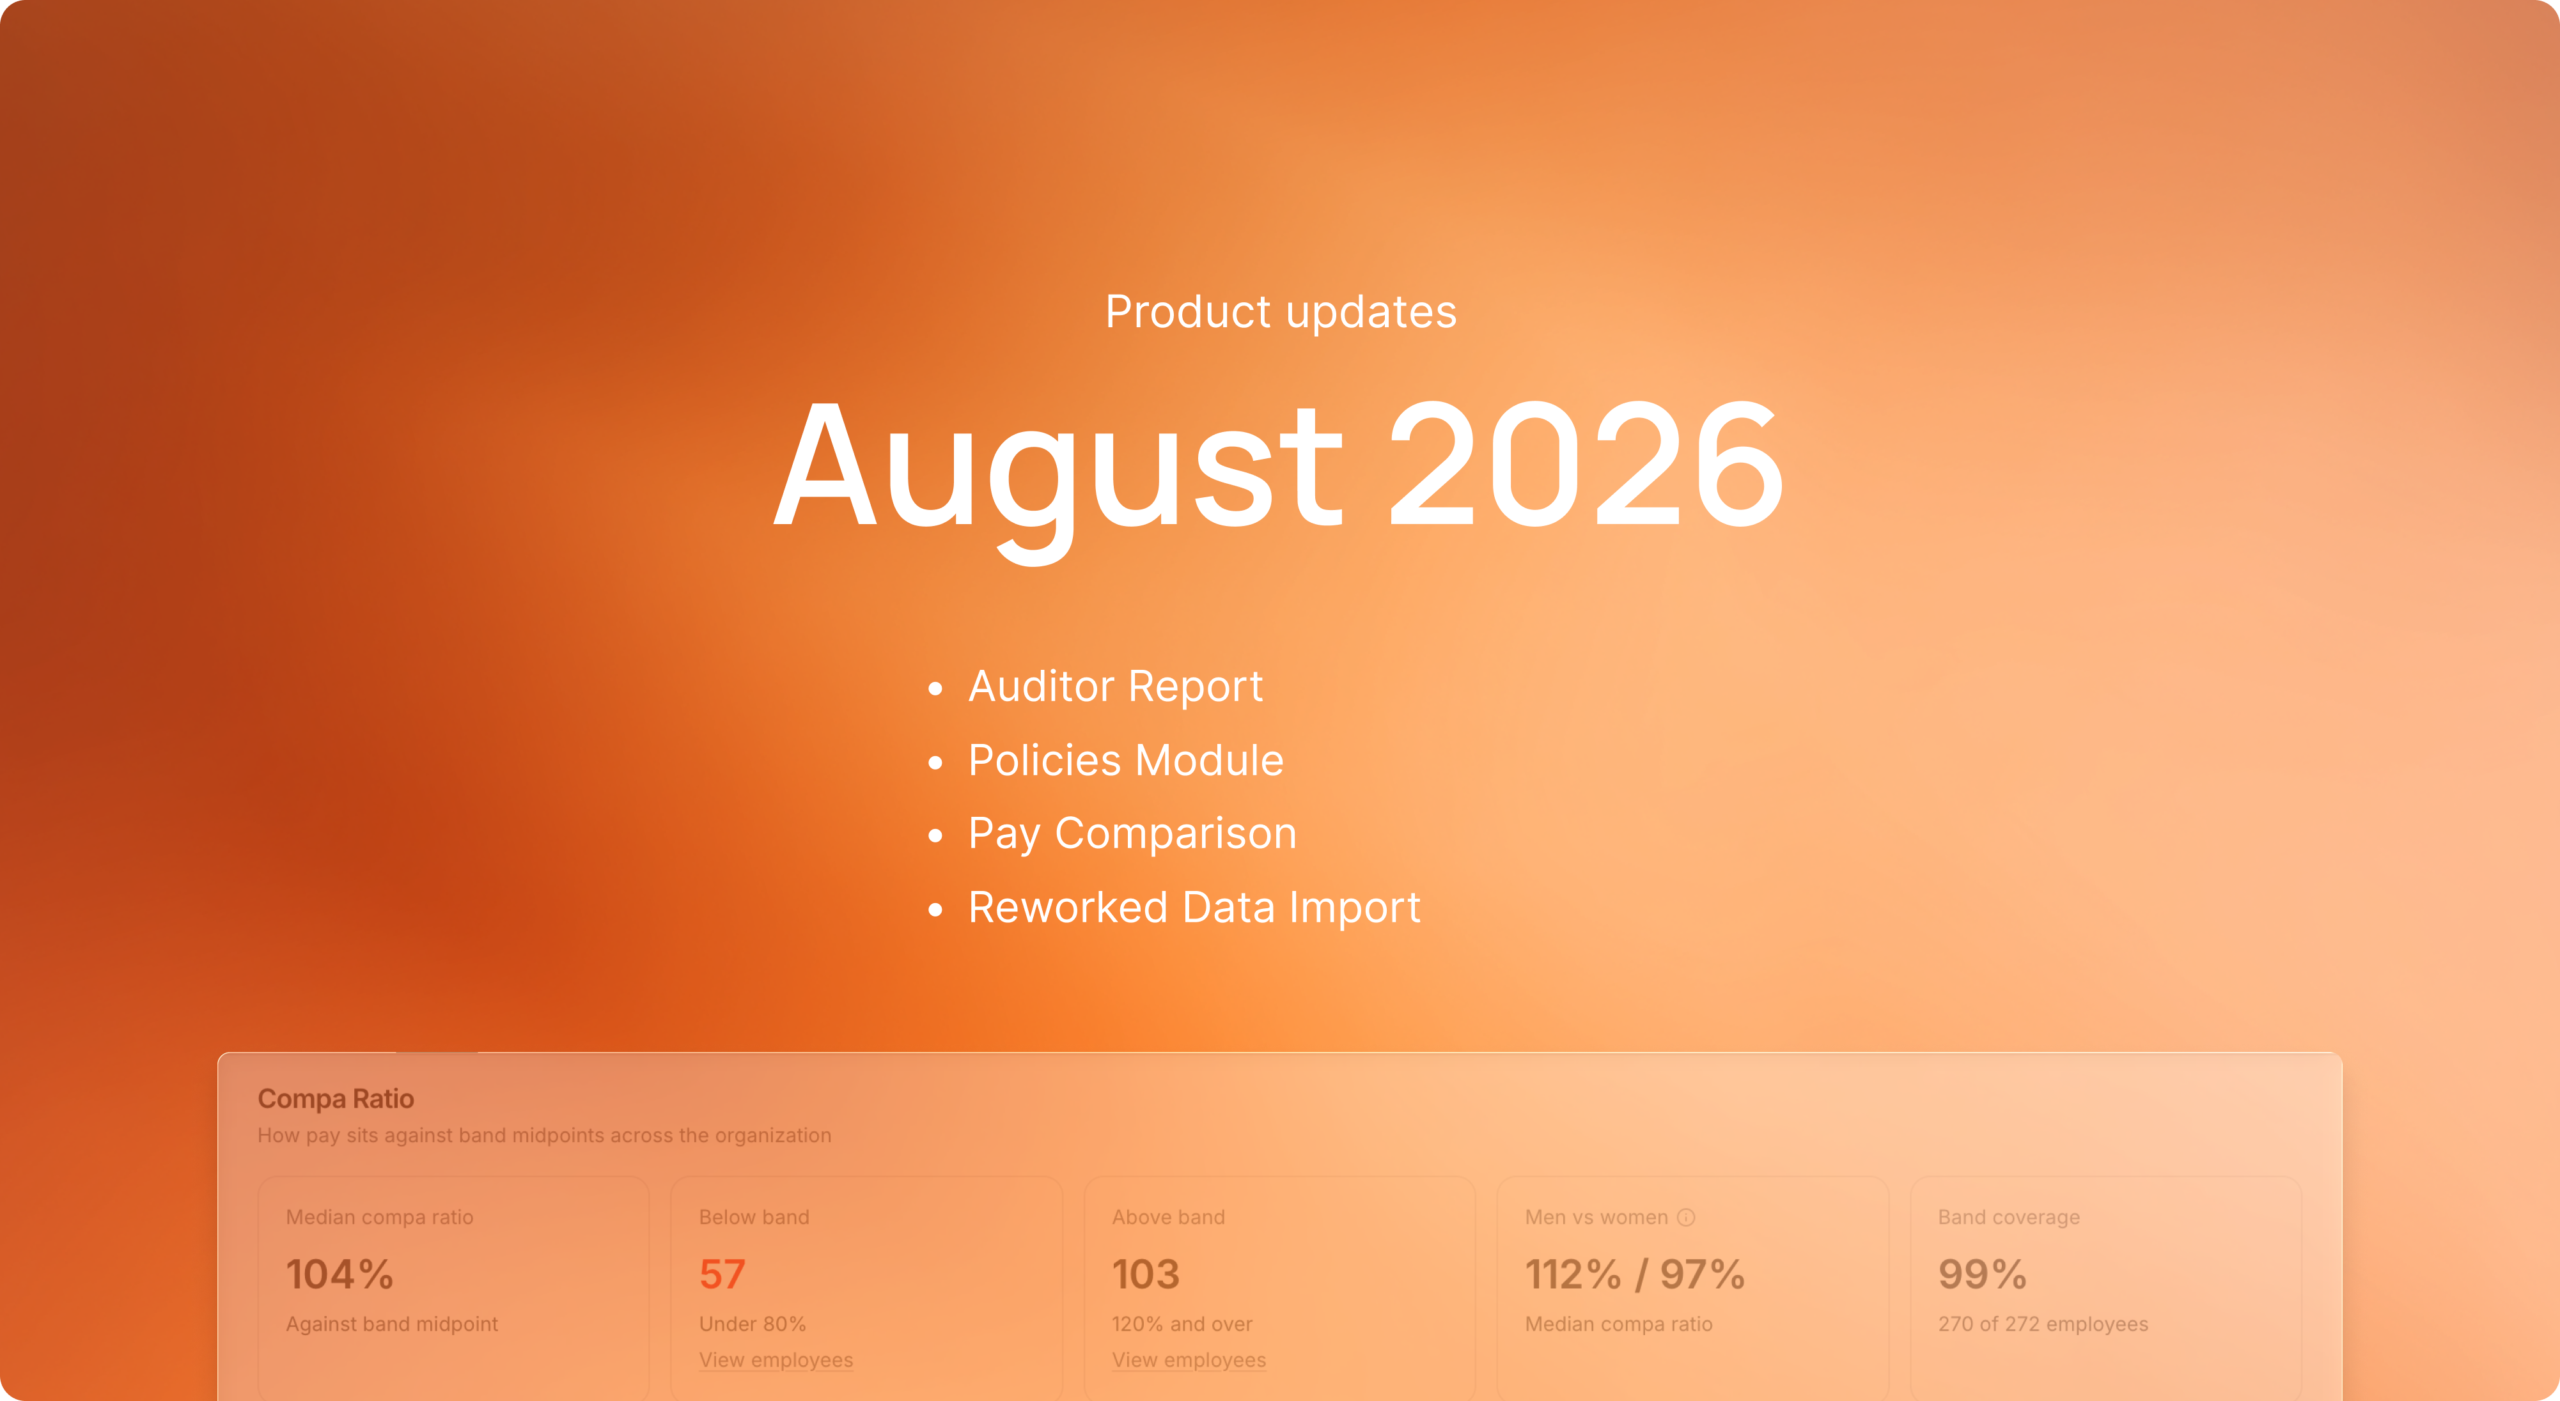
We skipped the July post (sometimes you need to balance with the heavy product work, right?), so this update covers two months of shipping: over 100 updates in total. The headline acts: a white-box Auditor Report that lets an outside expert reproduce your pay equity analysis step by step, a new Policies module that drafts pay policies with your live pay data embedded in them, and a rebuilt Pay Comparison view that shows the basis behind every number it presents.
Here’s the summer at a glance, then the details.
July and August at a glance
| Area | What’s new |
|---|---|
| Pay equity analysis | The Auditor Report: a white-box export that lets an auditor reproduce your analysis, plus a Compa Ratio view on the Analysis page |
| Policies (early access) | A new module in early access: draft pay policies from templates, with your live pay bands, job grades, and career ladder embedded |
| Pay comparison | Any employee’s pay next to position peers and equal-value cohorts, with the basis of every figure spelled out |
| Import flow v2 | Rebuilt import across every data scope, with a row-by-row preview you can edit before anything is written, and organization snapshots with one-step restore |
| Settings and personalization | A searchable settings area, dark mode, employee emails from your own domain, and an Early Access section with an organization-level AI toggle |
| Scale and platform | Analytics, pay bands, and pay equity tuned for organizations of 10,000+ employees, on an upgraded platform foundation |
An auditor report that shows its work
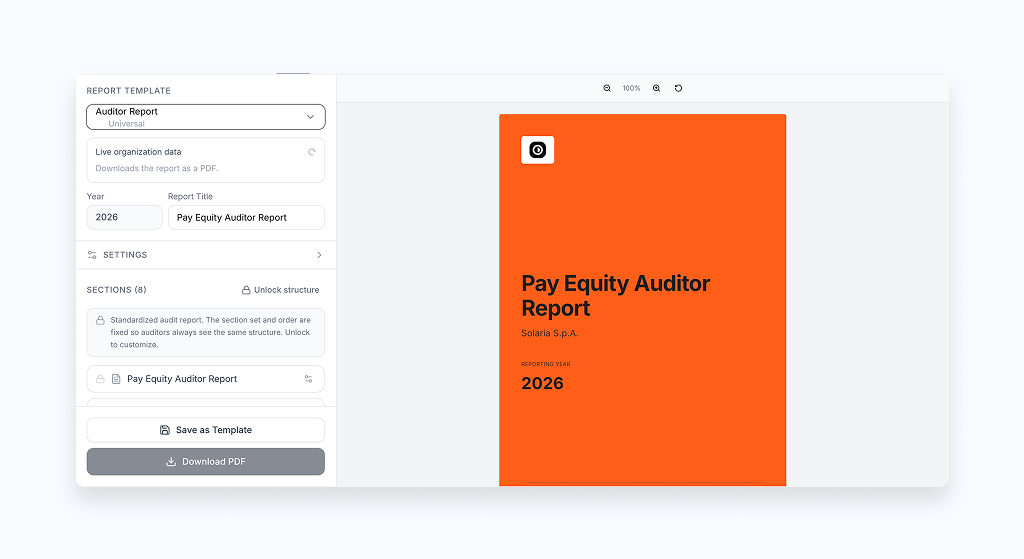
A pay equity analysis is only useful if you can defend it. When a works council, an equality authority, or an external auditor asks how you arrived at your adjusted pay gap, “the software calculated it” is not an answer. That is the problem the new Auditor Report solves.
From the report builder, you can now generate a complete white-box bundle of your pay equity analysis: the methodology with the exact model constants published, the per-employee data rows behind the regression, a register of which employees were excluded from the analysis and why, aggregate cohort tables, and the data-quality evidence for the snapshot the report describes. The bundle even includes a script that re-derives the published coefficients and gaps from the exported rows, so a reviewer can reproduce your results independently rather than take our word for them. Alongside the headline analysis, the report carries a pooled cross-check model in the format statistical reviewers expect, giving auditors a second angle on the same conclusion.
All of this happens without exposing anyone. Employee rows are pseudonymized with per-export codes, the mapping is never stored, and the bundle contains no names, emails, or free-text notes. Aggregate tables suppress cells small enough to identify individuals, and generating the report requires both analytics and export permissions, with every export recorded in the audit trail.
In short: your pay equity numbers now come with everything an auditor needs to reproduce them, without a single employee being identifiable.
Draft your pay policies where your data lives
The directive expects employers to make the criteria for pay and pay progression accessible to employees (Article 6), and those criteria must be objective and gender-neutral. In practice, most companies keep their pay policy in a document that drifted away from reality years ago, if it exists at all.
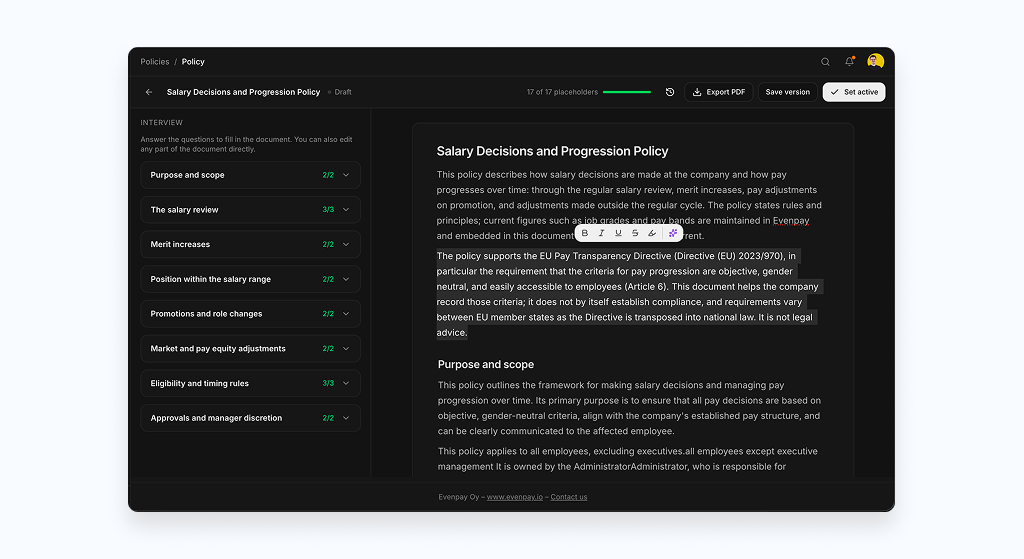
The new Policies module, now in early access, closes that gap. Start from a template, such as a remuneration policy or a career development policy, available in English and Finnish. A split-view builder walks you through each section with plain-language questions on one side while the document takes shape on the other, and the document stays fully editable the whole way. If a section reads clumsily, a per-section AI rewrite cleans it up without touching the rest.
What makes this different from writing the policy in a word processor: live data blocks. Your actual pay bands, job grades, and career ladder render inside the document, straight from your Evenpay data. Policies are versioned, so you can show what the policy said at any point in time, and export to a polished PDF that snapshots the data blocks as they stood at export.
In short: a pay policy that quotes your real pay structure, stays current as that structure changes, keeps its version history, and exports to PDF when someone asks for it.
Pay comparison with the basis spelled out
Comparing one employee’s pay against their peers is where most transparency conversations start, and a comparison figure without a visible basis creates more questions than it answers. The rebuilt Pay Comparison view shows an employee’s pay next to their position peers and their work-of-equal-value cohorts, both raw and FTE-adjusted, and then explains itself.
The compared pay figure now carries an itemised breakdown of exactly which pay components it includes, with a clear note when a fallback basis is in use and a reconciliation between the raw and FTE-adjusted figures so the two never appear to disagree. Group averages decompose into per-component averages, so you can see what actually makes up a peer group’s number. Cohort tooltips name the resolved equal-value cohort and how many positions it spans, the difference indicator explains which direction means what, alert icons explain their thresholds, and small peer groups are flagged as such.
In short: every comparison now carries its own explanation, so the person reading it can answer “how does this pay compare?” with confidence in what the numbers mean.
Improvements and fixes
The long list, grouped so you can skim to what’s relevant to you.
Imports and data
- Imports were rebuilt end to end: load any part of your data from a spreadsheet across eleven scopes, from employees and positions to compensation components, each with a row-by-row review that shows exactly what every row will do and lets you edit values in place before anything is written. Re-running an import is safe by design.
- Data mapping shows better sample previews, detected values act as one unified step, and you can navigate back without losing work. Delimiter detection now handles files whose header row spans multiple lines.
- Take a manual snapshot of your whole organization before a big change, and restore it in one step with a preview of what the restore will do.
- Imports handle timestamp columns, position updates via CSV, and deletable positions, and integration-synced custom-field values now flow into Employee Insights and breakdowns.
Analysis and reporting
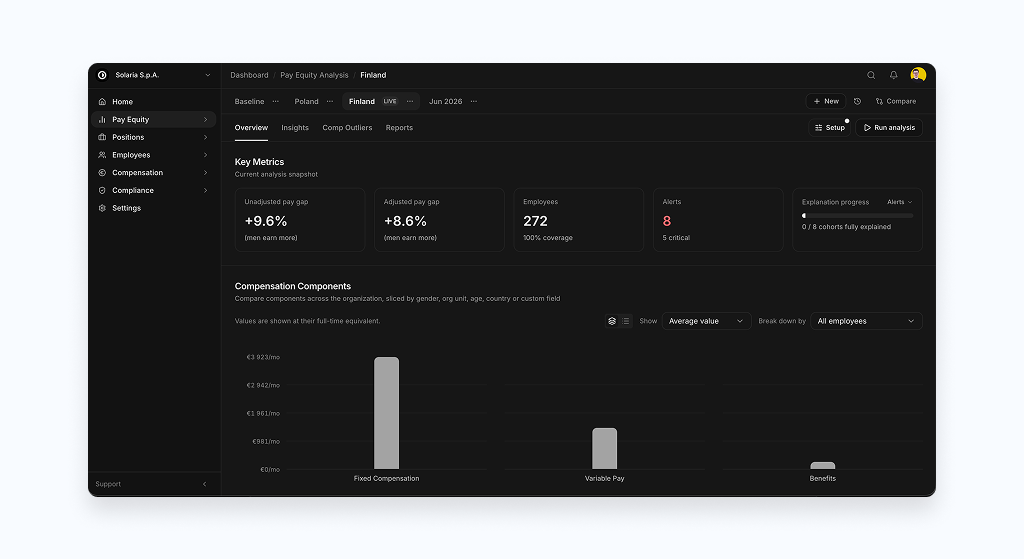
- A new Compa Ratio component on the Analysis page shows how actual pay sits against band midpoints across the organization.
- Work-of-equal-value setup now offers country, city, and worksite consistently in Compliance Setup, with the factor catalogue deduplicated.
- The Pay Bands chart stays readable at large-organization scale: dense columns are binned and bands roll up to their parent dimension.
- The pay and performance chart normalizes currencies for axis positions and shows both currencies in tooltips, so multi-currency organizations compare fairly on one chart.
- Scenario activation previews go down to the person: employee names, before and after pay, and monthly and annual cost. Opening a scenario’s setup no longer marks it as needing recalculation.
Pay information requests
- Choose whether reports list every enabled compensation component, including those at zero, or hide the zero rows with one toggle.
- Hourly rates can follow the contractual basis your collective agreement defines: set the contractual divisor on a work schedule and reports calculate from it.
- Request history now lists pending requests too, and reports render correctly in every locale, with component names always reflecting their current definitions.
Settings and personalization
- Organization and personal settings live in one redesigned, searchable area: find any setting by typing its name.
- Dark mode arrived as an experimental personal preference: light, dark, or follow your system.
- Employee emails can be sent from your own domain, with a guided DNS verification flow and a per-organization sender name.
- A new Early Access section gives admins one place to try upcoming features, including an organization-level toggle for Evenpay’s AI features.
- Admins can copy an invitation’s accept link straight from the invitation list, and invitations work regardless of how the invited user signs in.
Scale, performance, and platform
- Analytics pages no longer load the entire roster on every visit, pay equity previews moved off the request path, and lists and aggregates stay accurate and fast beyond 10,000 employees.
- The Positions page loads with a fraction of its previous requests, and the pay equity page dropped redundant pipeline runs in large organizations.
- The platform moved to its next major foundation across the stack, from the backend runtime to the frontend framework, bringing faster rendering and current long-term-support versions everywhere.
- A security sweep tightened access controls, input handling, and security headers across the application, verified by our continuous automated review.
Frequently Asked Questions
See it on your own data
That’s July and August. The theme running through both months is defensibility: numbers that show their working, policies that quote real data, and comparisons that explain themselves. If you’d like to see any of this against your own structure and numbers, schedule a demo and we’ll walk you through it. See you next month.